Danish energy sector: TPES and features of bioenergy development
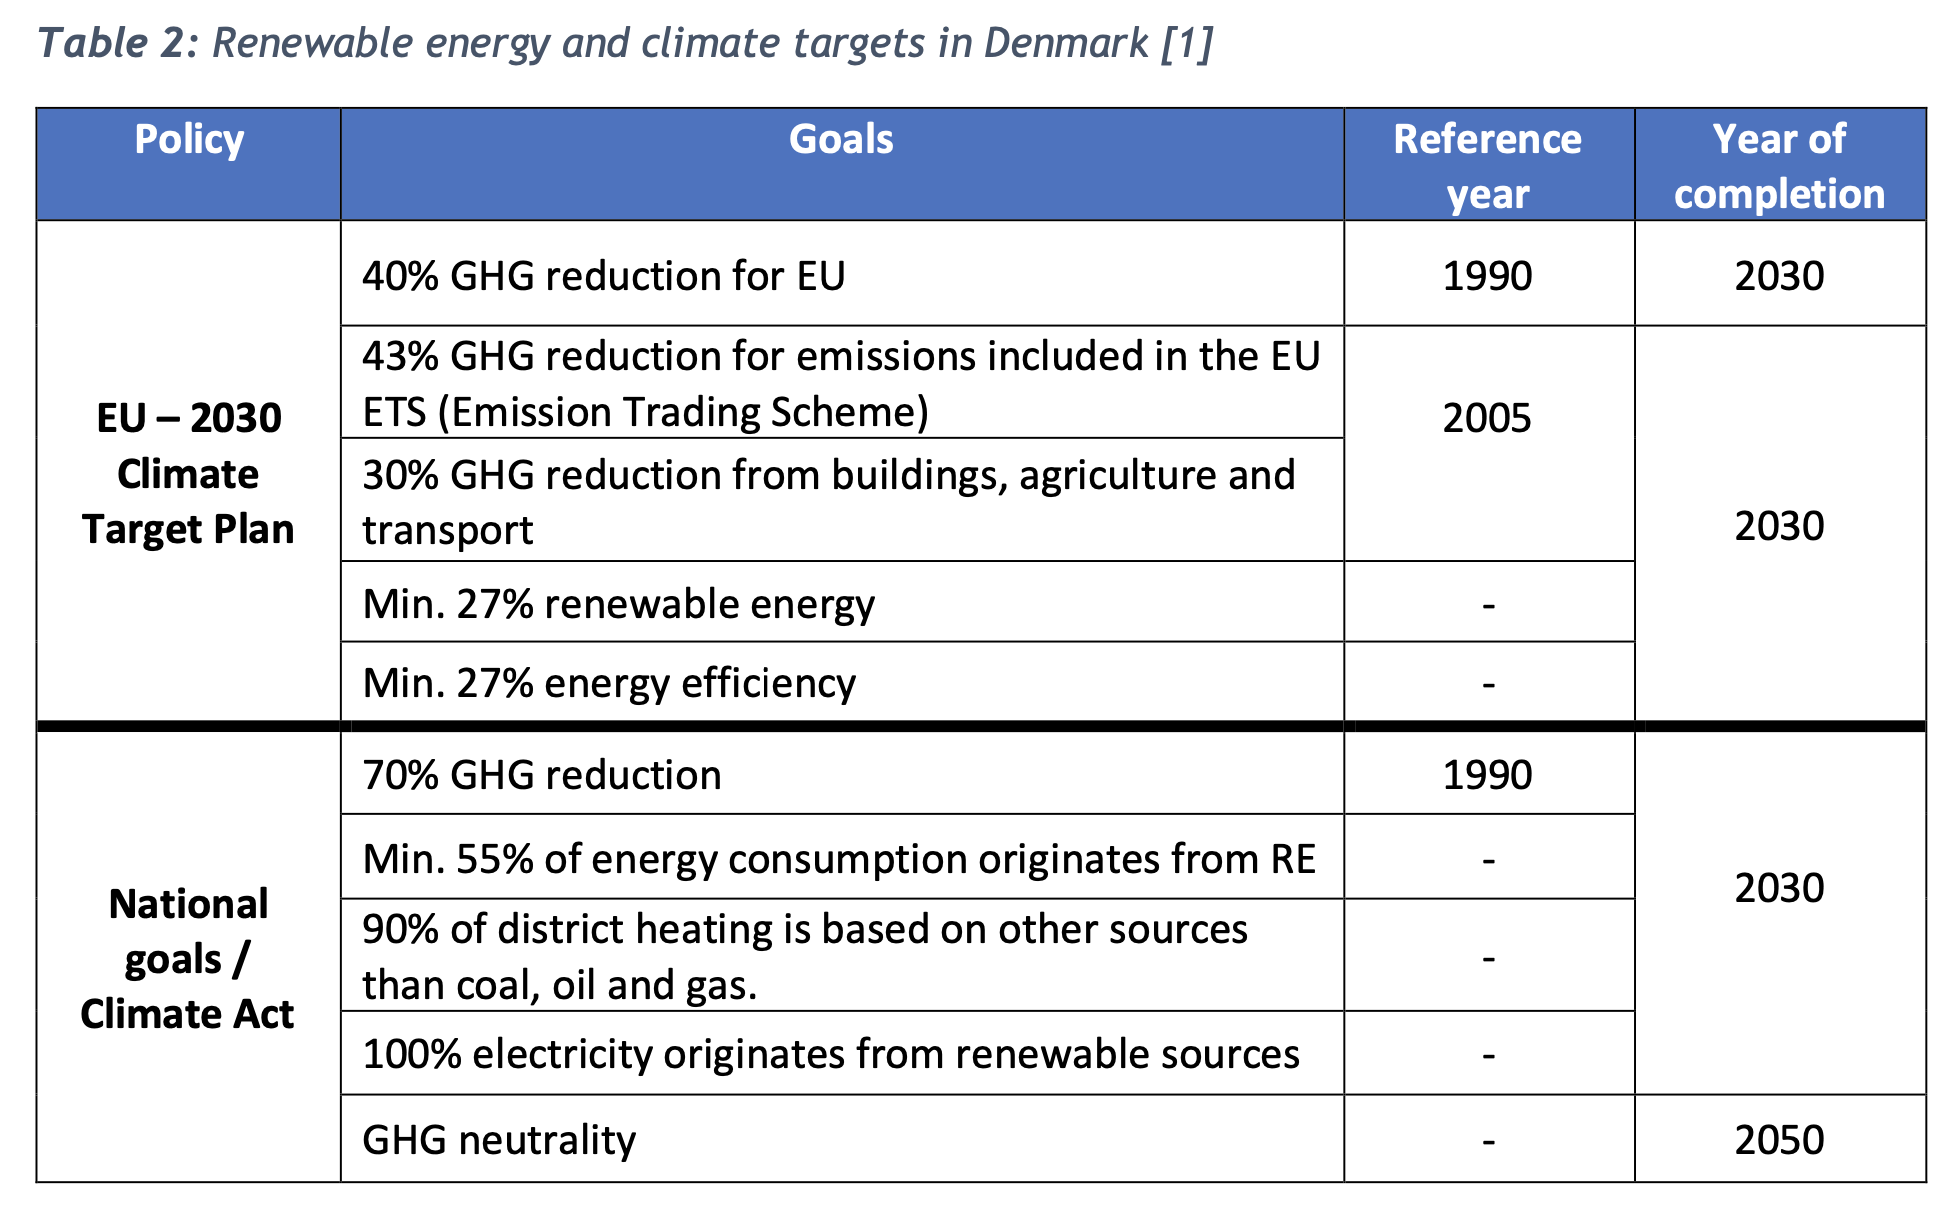
Renewable energy and climate goals in Denmark are very ambitious. And most importantly — real. The main documents contain a list of such goals:
- European Union’s 2030 Climate target plan;
- Climate Act, adopted by the Danish Parliament.
In particular, Denmark has implemented a national legally binding Climate act to meet 70% GHG reduction by 2030 and be climate neutral in 2050.
Total energy supply (TES)
The total energy supply (TES) of Denmark in 2019 amounted to 669 petajoules (PJ) with fossil fuels (oil, gas, coal) contributing 58% (Diagram). Oil products account for 37% of TES (247 PJ); natural gas accounts for 16% (107 PJ), coal products for 5.5% (37 PJ) and non-renewable waste 2.7% (18 PJ).
Renewable energy sources have a share of 36% or 240 PJ – 175 PJ bioenergy, 58 PJ wind energy, and 6 PJ solar energy. 21 PJ of electricity is imported, which represents 3% of Danish TES.
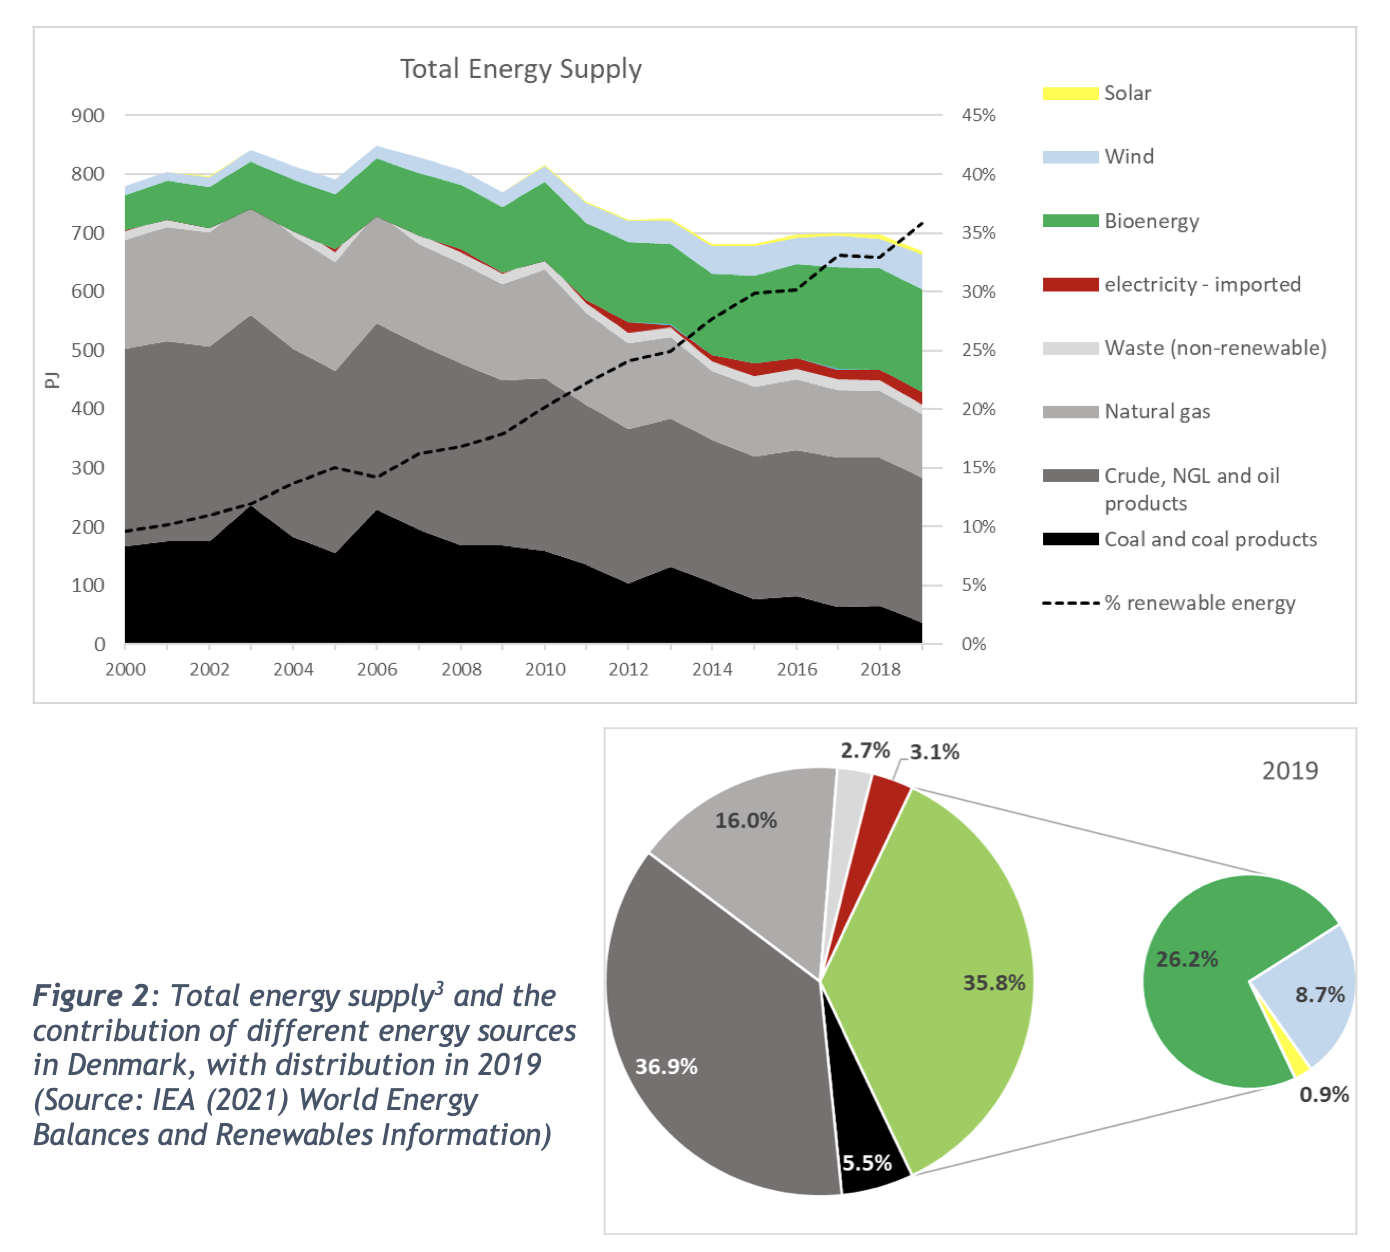
An important trend is the reduction of energy supply. Between 2006 and 2013 total energy supply in Denmark had a declining trend, stabilizing around 700 PJ after 2013. In the past years, there was a clear trend to shift from fossil fuels to renewable energy. Compared to 2010 the share of coal in TES has gone down from 20% to 5.5%, natural gas decreased from 22% to 16%, while oil was stable around 36%. In the same period, the share of renewable energy steadily increased from 20% to 36% of TES.
In the same period, the share of renewable energy steadily increased from 20% to 36% of TES. In the total supply of energy from RES in 2019, the leaders were biomass and wind energy, the share of solar energy is still relatively small.
The total supply of renewable energy sources in 2019 is dominated by biomass and wind energy. The share of solar energy is still relatively small. The overall share of bioenergy in the total energy supply increased from 20.3% to 26.2% compared to 5 years earlier, while solar and wind combined increased from 7.4% to 9.6%.
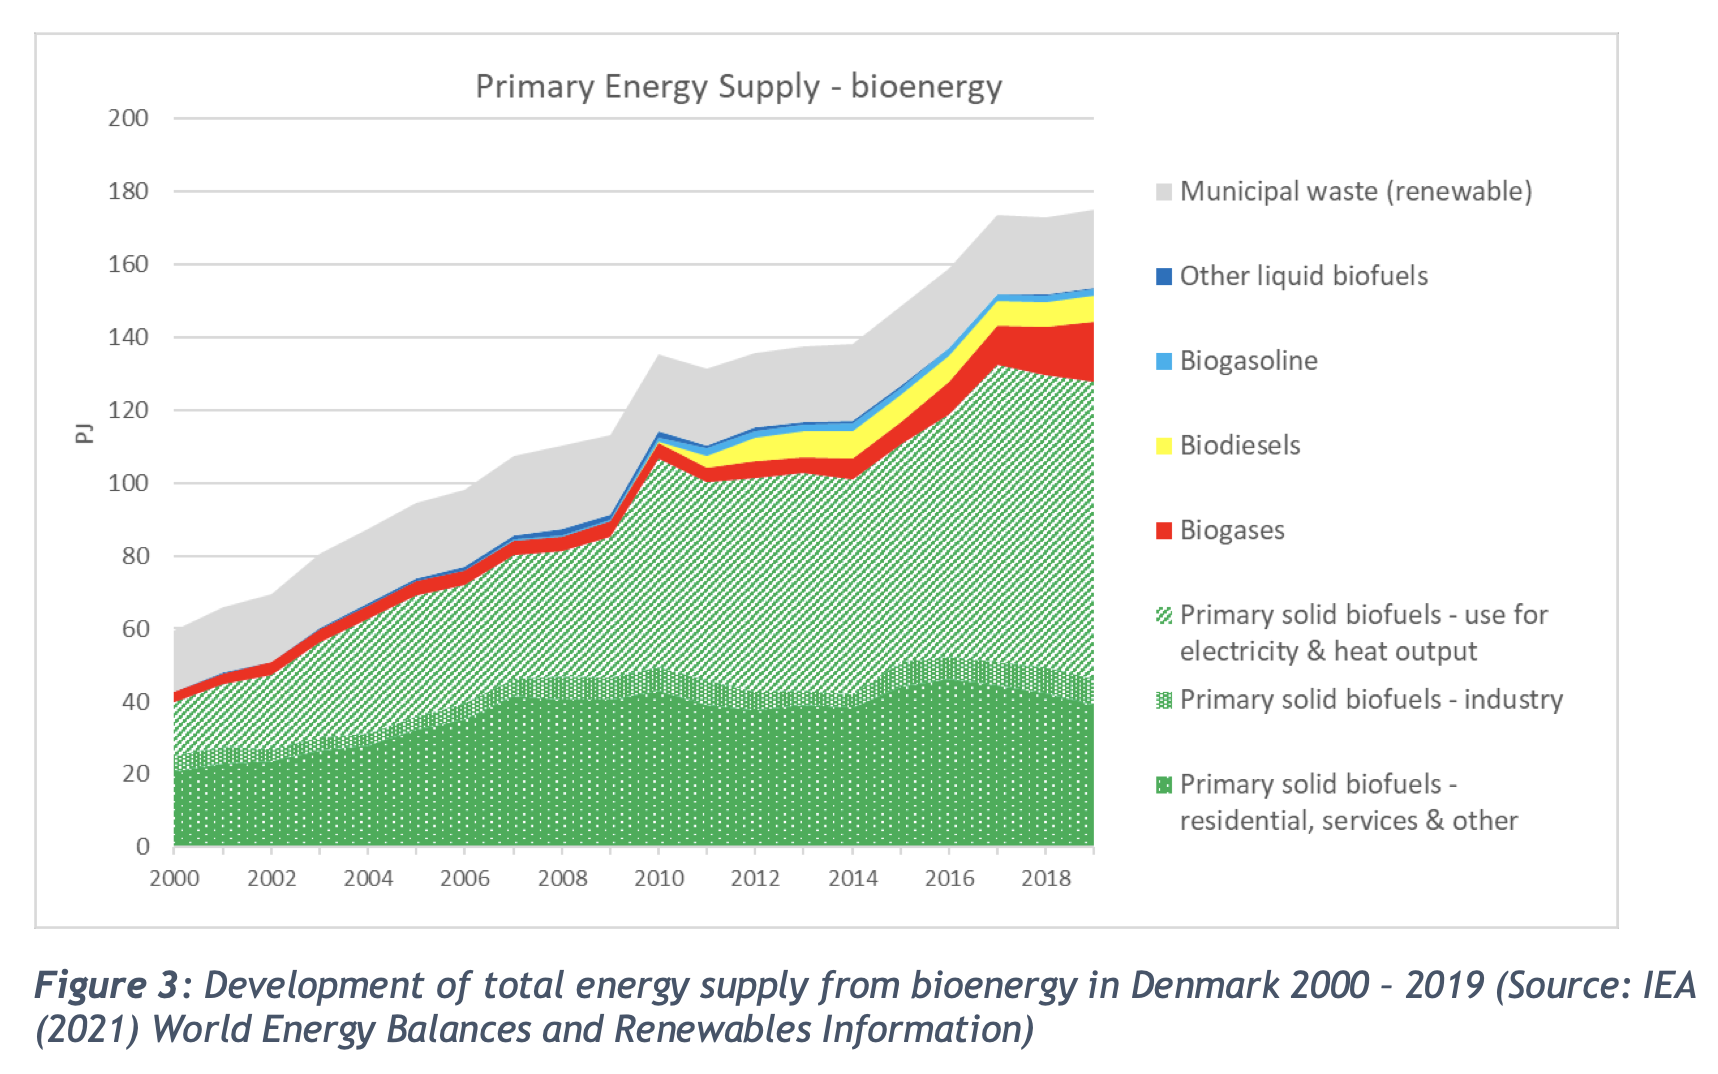
As shown in Figure 3, solid biofuels represent the major part (75%) of bioenergy in Denmark. They include fuelwood, wood chips, wood pellets, and straw. The other bioenergy types are renewable MSW (12%), biogas (7.5%), biodiesel (4%), and biogasoline (1%). Read more on the Sustainable Agribusiness Forum (SAF).
Features of the development of bioenergy in Denmark
- More and more solid biofuels. There was a consistent growth of solid biofuels, growing from 40 PJ in 2000 to 127 PJ in 2019. The main increase was in CHP and heat plants, particularly replacing fossil fuels for district heating. The use of solid biofuels in residential applications is quite stable. The use in industry is marginal.
- Energy from renewable share of solid household waste. Energy from renewable MSW is fairly stable around 21 PJ since 2005.
- Import of wood and widespread use of straw. The forest area in Denmark is quite low, but most use of solid biofuels in Denmark is not linked to the domestic forests. There is an important use of straw for energy production; imported wood fuels also have a significant role.
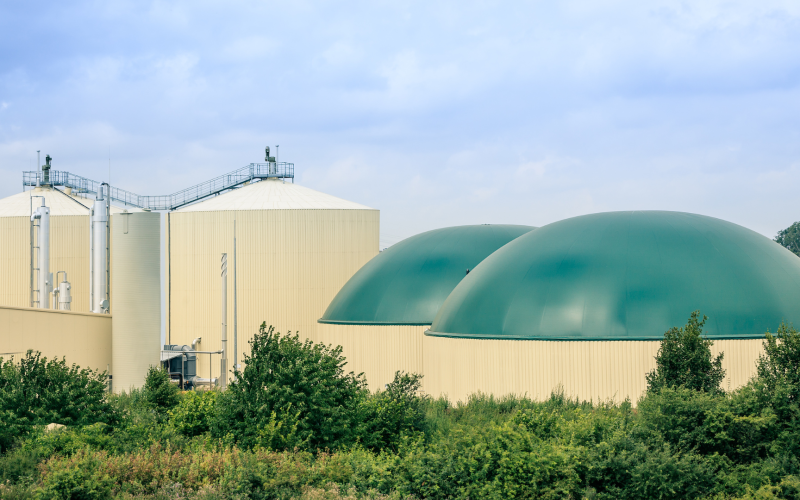
- Biogas. There was a solid base of biogas around 4 PJ up to 2012. After 2012 biogas saw a strong growth up to 17 PJ in 2019.
- Biofuels in the transport sector. The main growth of transport biofuels was between 2010 and 2012 up to 9 PJ and has stabilized since.
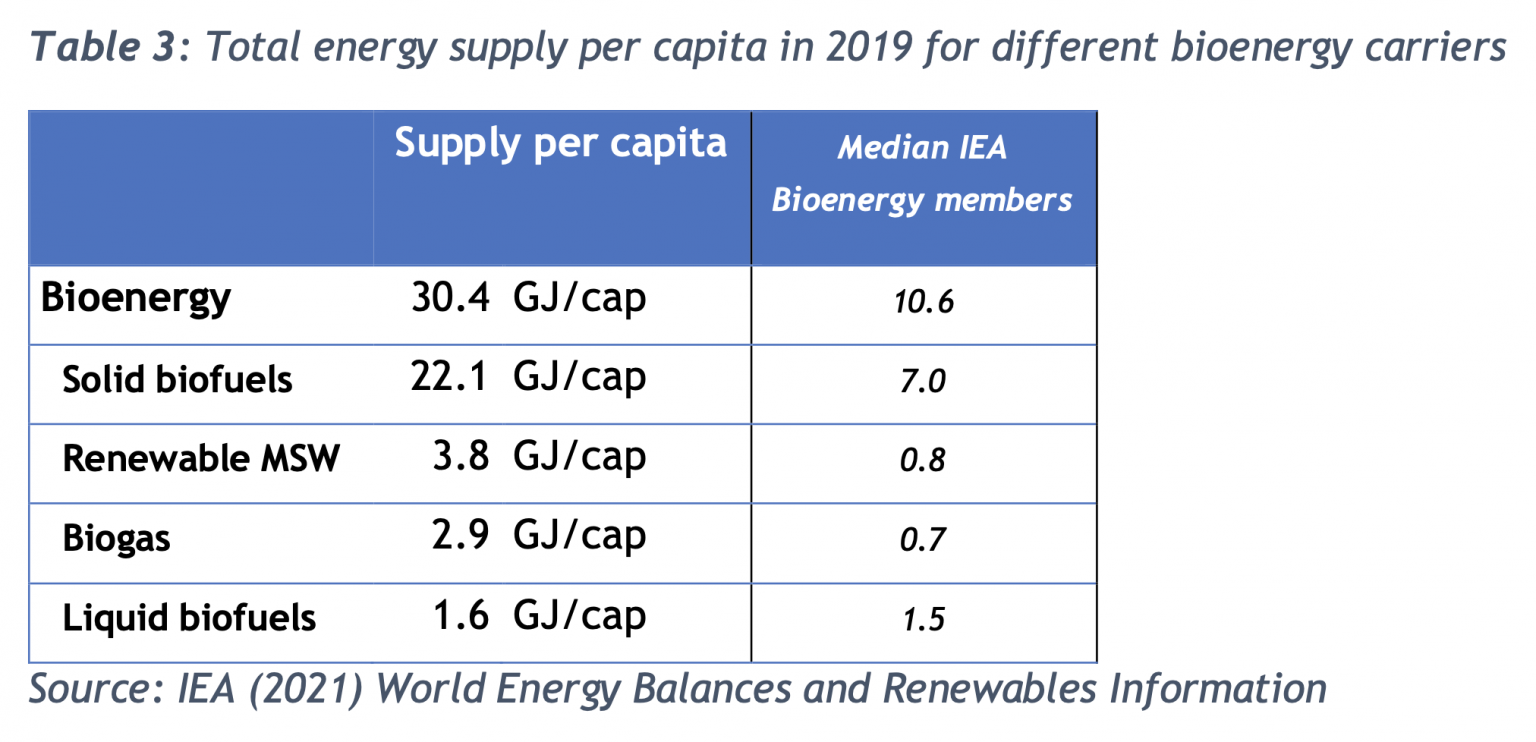
The table displays the 2019 total bioenergy supply values on a per capita basis. Compared to the other 24 member countries of IEA Bioenergy (expressed per capita), Denmark ranks at the top for renewable MSW, at second place for biogas (after Germany), at the high end for solid biomass, and in the middle for liquid biofuels.
According to the report of the IEA Bioenergy Technology Collaboration Programme (TCP)) Implementation of bioenergy in Denmark.
Source: the article on the SAF platform “Danish energy sector: ambitions and plans”: https://saf.org.ua/en/news/1497/.
It will be recalled that UABIO is a partner of the SAF Ukraine (Sustainable Agribusiness Forum) that was created in 2017 on the initiative and support of the European Bank for Reconstruction and Development (EBRD).